
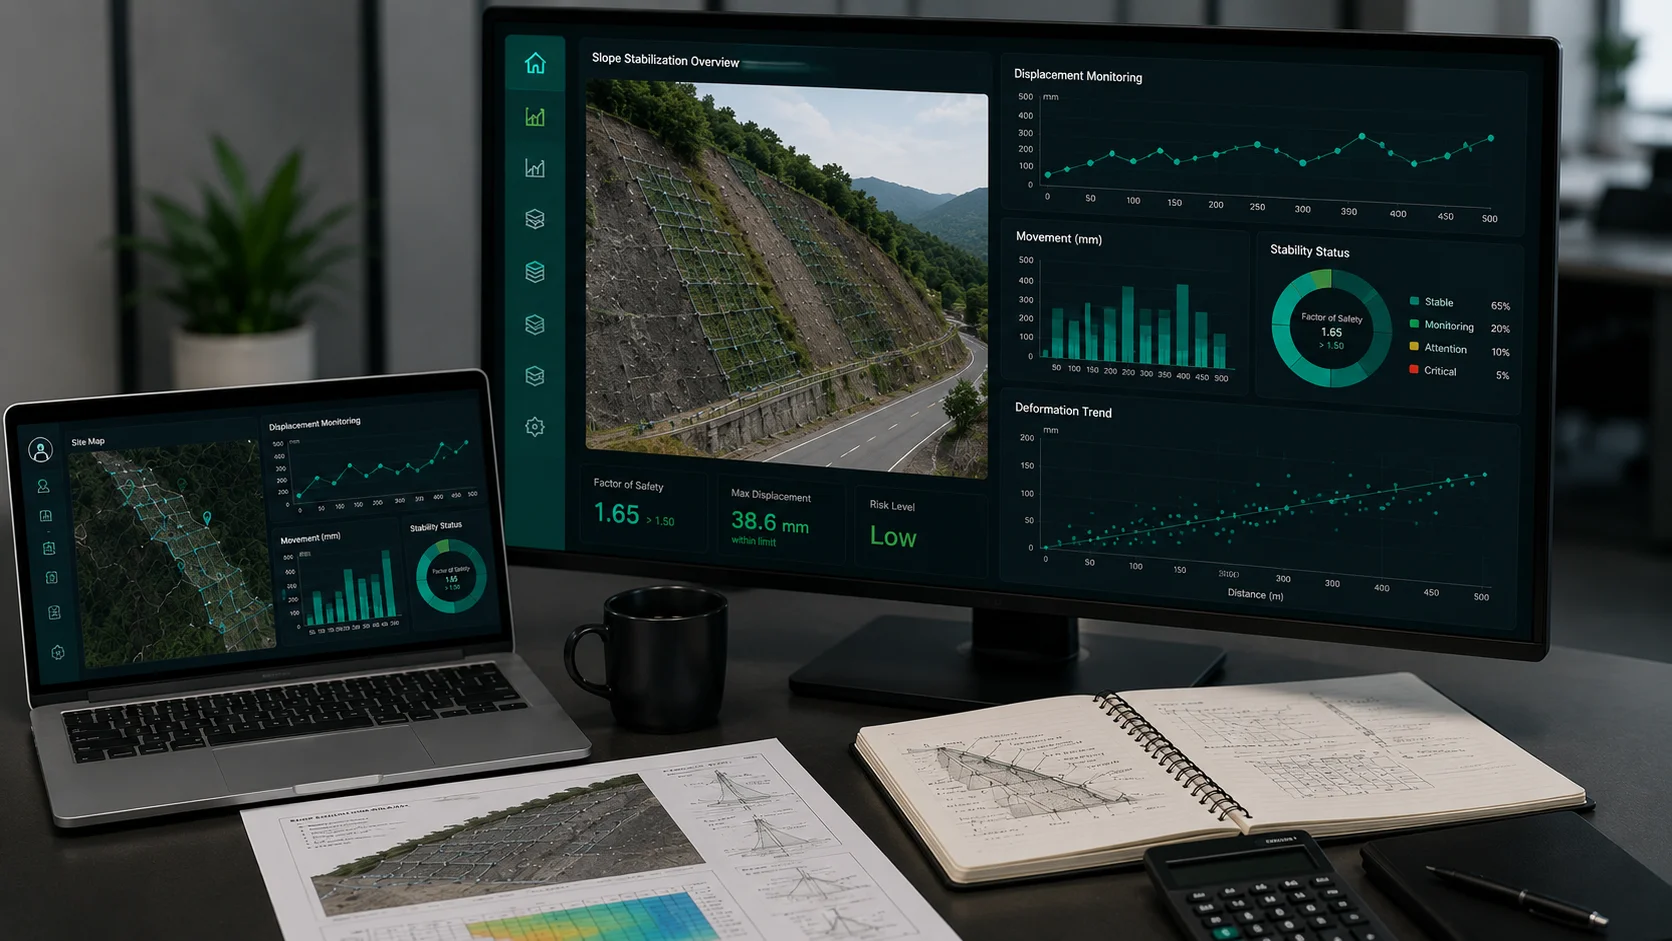
Dataanalyse i anlægsteknik: Transformation af infrastruktur med datadrevne beslutninger
Transformer anlægstekniske data til handlingsorienteret indsigt gennem avanceret analyse, interaktive dashboards og intelligent rapportering.
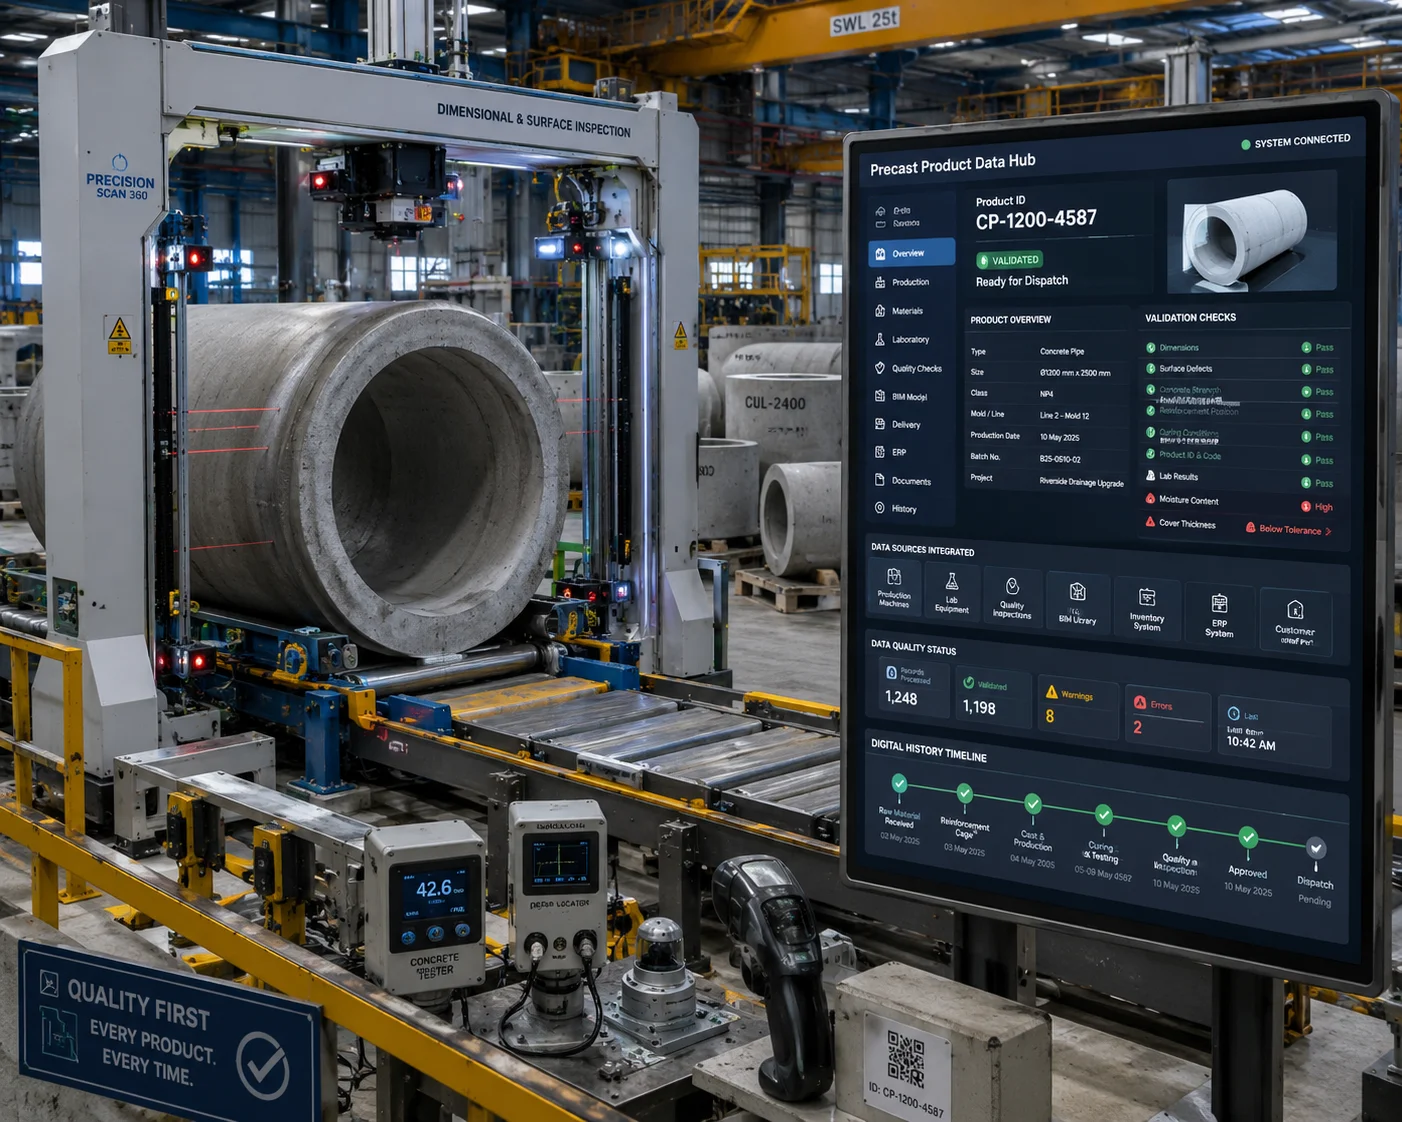
Håndtering af ingeniørdata
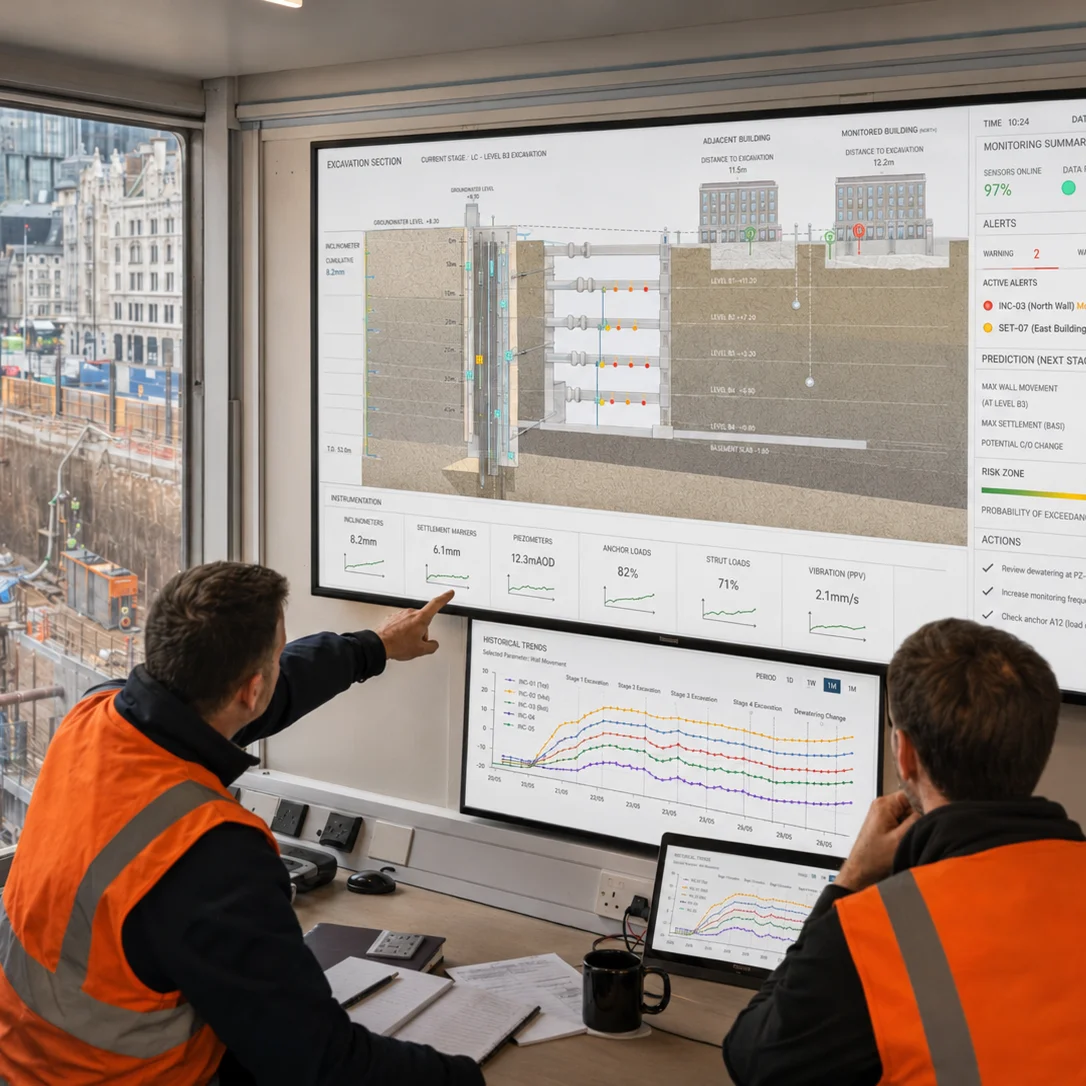
Analyse og præstationsindsigt
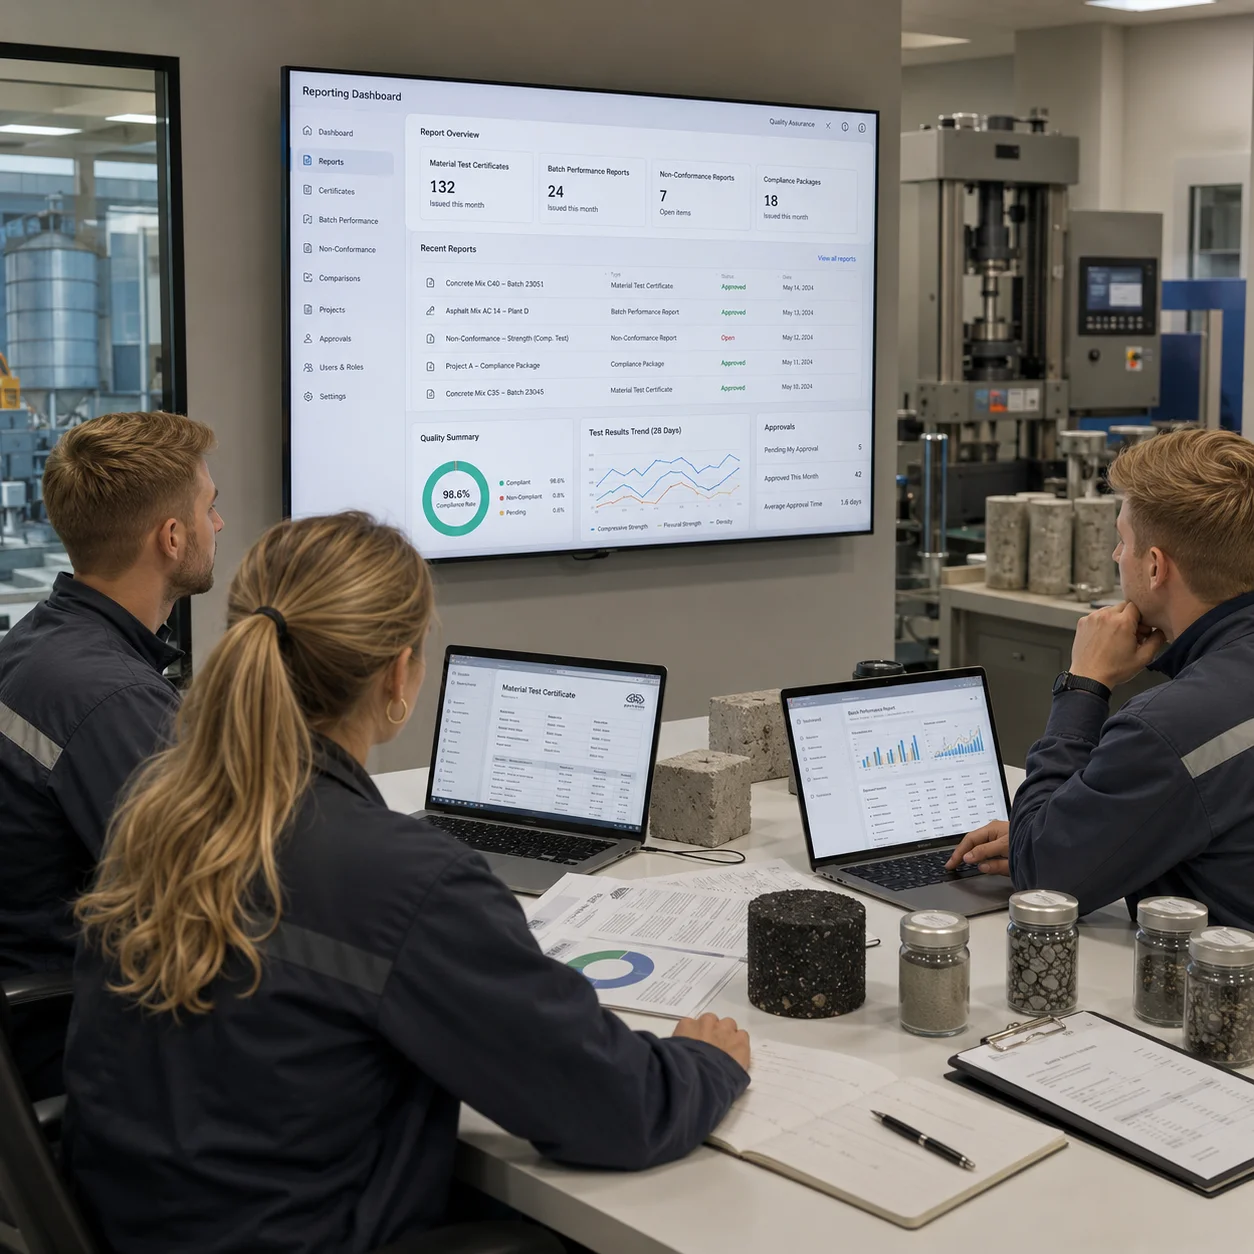
Rapportering og beslutningsstøtte
Enterprise Analytics-løsninger

Lignende projekter
Opdag flere innovative projekter:



Gode
Løsninger
Starter Med En SamtaleGode Løsninger Starter Med En Samtale
Vil du udforske, hvordan vores tjenester kan få din virksomhed til at vokse?
Dataanalyse i bygge- og anlægssektoren
Et motorvejsprojekt genererer hver eneste arbejdsdag landmålingspunkter, trykprøvningsresultater for beton, fremdriftsrapporter, følgesedler og tilsynsnotater. De fleste af disse registreringer arkiveres én gang, rapporteres én gang og fremsøges aldrig igen. Dataanalyse i bygge- og anlægskonstruktion ændrer dette mønster. Metoden behandler ingeniør- og infrastrukturdata som en teknisk ressource til at besvare konkrete spørgsmål: hvorfor støbeproduktiviteten falder om vinteren, eller hvilke underføringer og stikledninger der nedbrydes hurtigst.
Analyse i denne sammenhæng handler ikke om dashboards for syns skyld. Målet er en systematisk fortolkning af ingeniørdata, der kvalificerer de beslutninger, rådgivere og entreprenører allerede skal træffe: tilbudskalkulation, receptjusteringer og prioritering af vedligehold. NEXATEK tilgår dataanalyse som et centralt lag i den digitale transformation i bygge- og anlægssektoren, funderet på data, der er tilstrækkeligt strukturerede til at kunne bearbejdes operationelt.
 Teknisk dataanalyse omsætter spredte projektdata til dokumenteret evidens, som teams kan anvende ved planlægning, kvalitetssikring og vedligehold.
Hvad betyder dataanalyse i bygge- og anlægsteknik?
Dataanalyse i bygge- og anlægssektoren er den strukturerede undersøgelse af projekt- og anlægsdata med henblik på at kvantificere ydeevne og understøtte ingeniørmæssige beslutninger. Råmaterialet er velkendt: tidsplaner, økonomiopgørelser, laboratorieresultater, tilsynsdagbøger og overvågningsmålinger. Analysen omdanner disse registreringer til tekniske nøgletal, såsom gennemsnitlig cyklustid pr. støbeetappe eller trykstyrkevariation pr. betonværk.
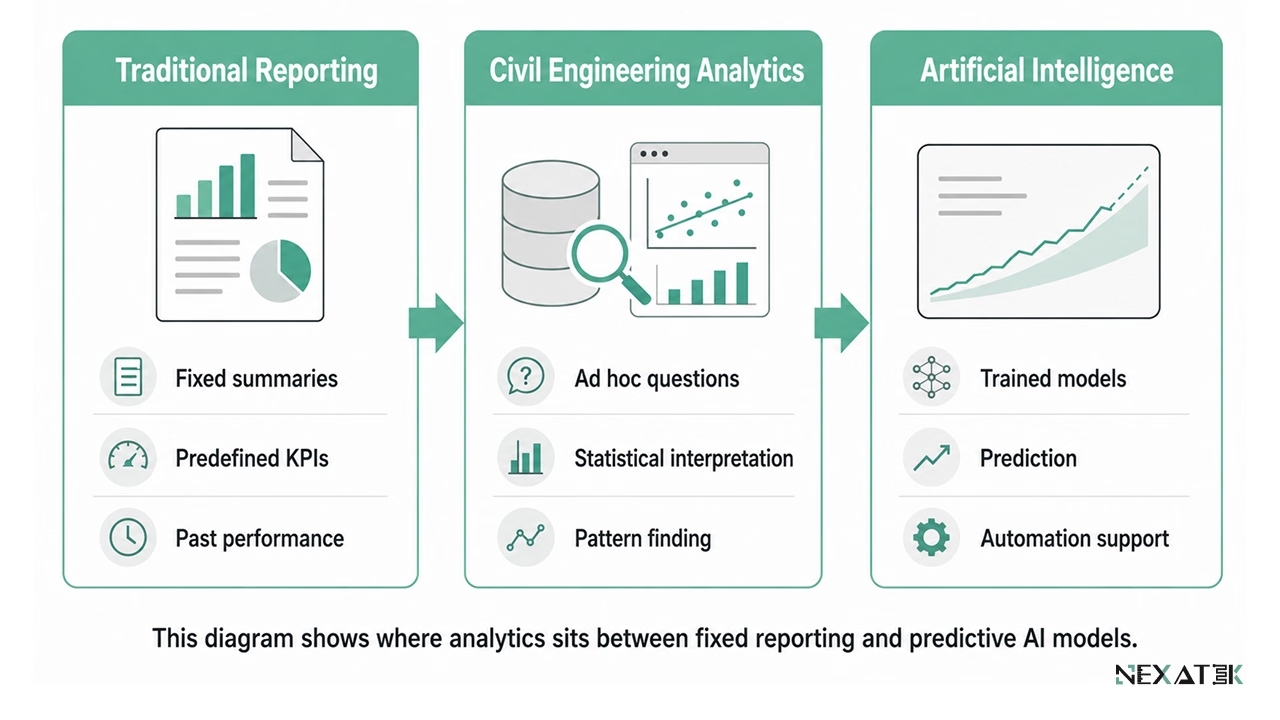
Begrebet placerer sig mellem to beslægtede områder, som ofte forveksles: Traditionel rapportering opsummerer historiske hændelser i et fastlåst format. Kunstig intelligens opbygger modeller, der lærer af data og udarbejder prognoser. Dataanalyse udfylder det praktiske mellemrum: Statistiske metoder og strukturerede forespørgsler besvarer definerede ingeniørfaglige spørgsmål uden krav om en forudgående trænet model.
I praksis omsætter en dataanalytiker i anlægsbranchen en problemstilling om forsinkede støbearbejder til en målrettet forespørgsel – og resultatet til konkret beslutningsstøtte.
Hvorfor er dataanalyse relevant for bygge og anlæg?
Behovet for dataanalyse drives af to strukturelle forhold, ikke af kortvarige teknologitrends: Datamængderne vokser kontinuerligt, mens standardværktøjet til dataopsamling fortsat er regneark.
Den stigende mængde af ingeniør- og projektdata
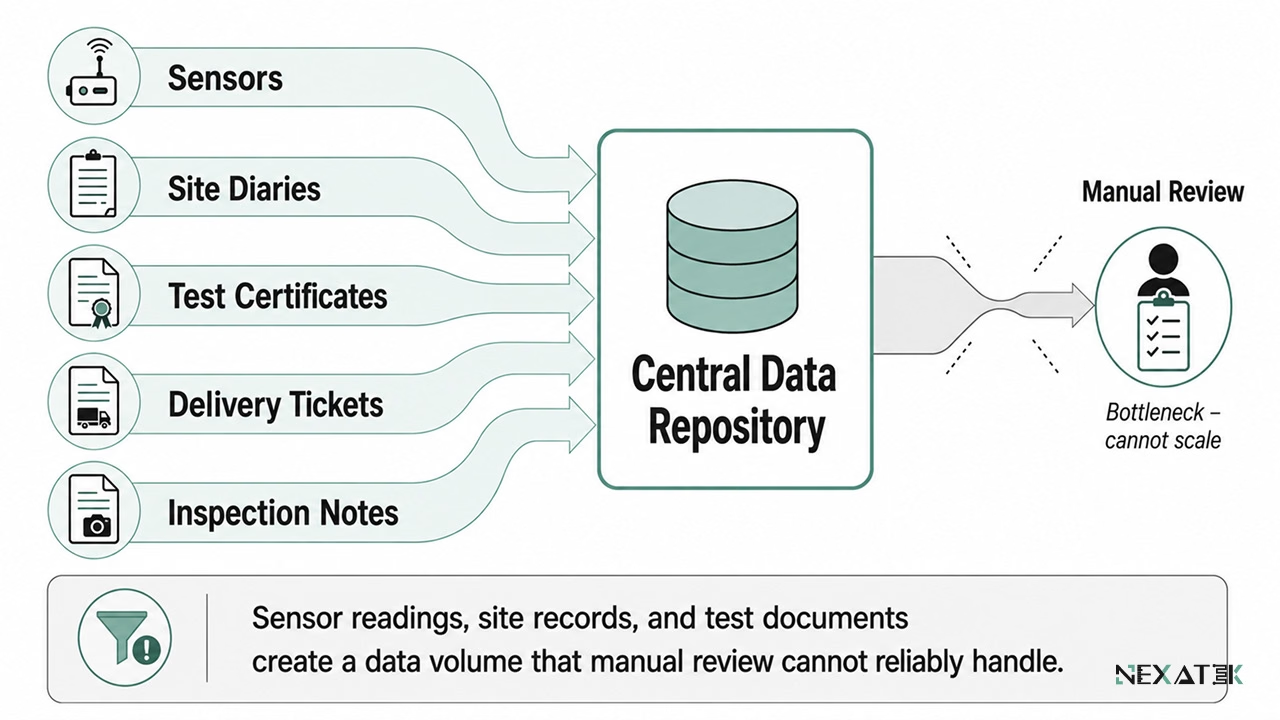
Et mellemstort infrastrukturprojekt genererer titusindvis af registreringer i løbet af sin levetid: tilsynslogger, blandingsrapporter, prøvningsattester, acontobegæringer og sensormålinger. Strukturel overvågning øger datamængden markant. En sætningsmåler, der logger hvert 30. minut, producerer over 17.000 målinger årligt – og en enkelt dæmning kan rumme snesevis af sådanne sensorer.
Projekt- og infrastrukturdata ophobes hurtigere, end et team kan nå at gennemgå manuelt. Dette udgør det grundlæggende argument for dataanalyse inden for anlægssektoren.
Begrænsninger ved manuelle analyser og statisk rapportering
Manuel analyse betyder i praksis ofte, at en medarbejder kopierer værdier fra 14 regneark over i et 15. Sammenstillingen af en månedlig statusrapport kan på denne måde lægge beslag på to til tre arbejdsdage, hvor hvert enkelt indtastet tal udgør en potentiel fejlkilde. Outputtet er desuden statisk: Når rapporten distribueres, er det underliggende datagrundlag allerede uger gammelt.
Statisk rapportering rummer endnu en svaghed: En fastlagt rapport besvarer udelukkende de spørgsmål, den oprindeligt er designet til. Spørger projektchefen, hvorfor betonudgifterne steg med 8 procent i et givent kvartal, viser rapporten kun selve stigningen. Den kan ikke bryde tallet ned på leverandør, bygningsdel, støbedato eller batchstørrelse.
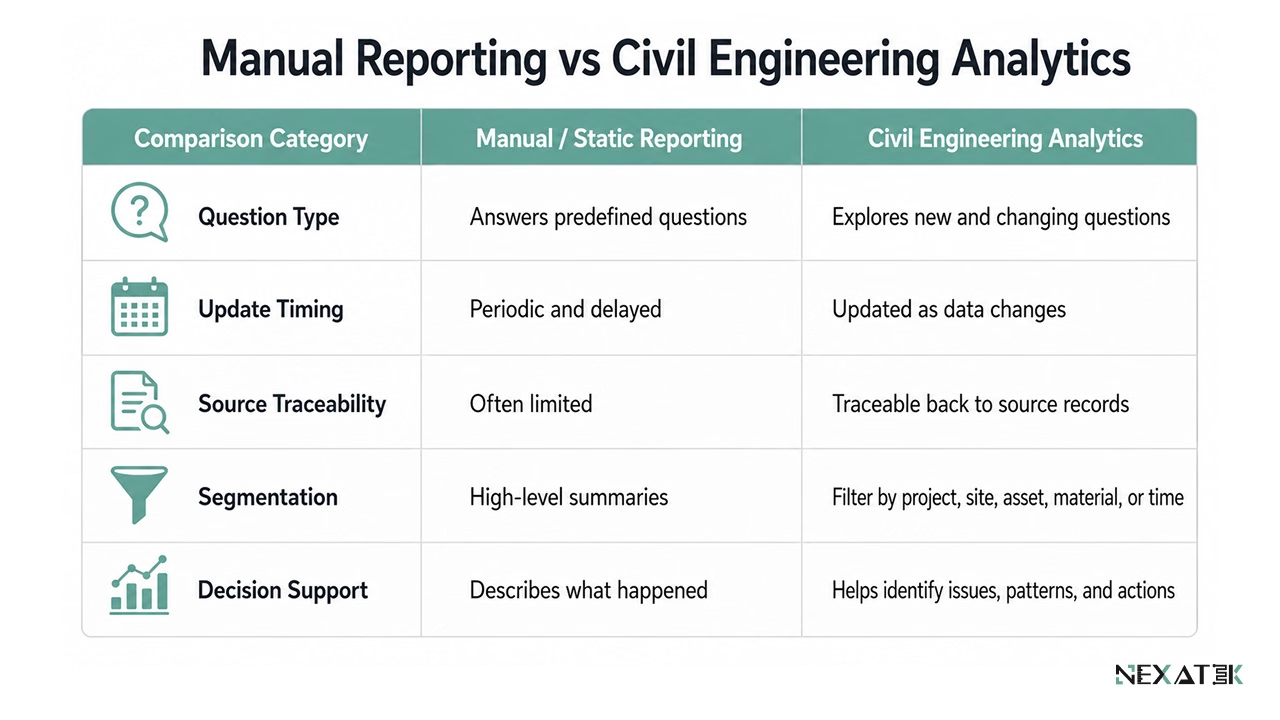
Denne sammenligningstabel viser, hvordan faste rapporter adskiller sig fra analytiske workflows i forhold til spørgsmålshåndtering, opdateringsfrekvens, sporbarhed og beslutningsstøtte.
Datatyper anvendt i anlægsteknisk dataanalyse
Fire datakategorier rummer hovedparten af den analytiske værdi. De kan analyseres hver for sig, men de stærkeste konklusioner opnås ved at krydskoble dem.
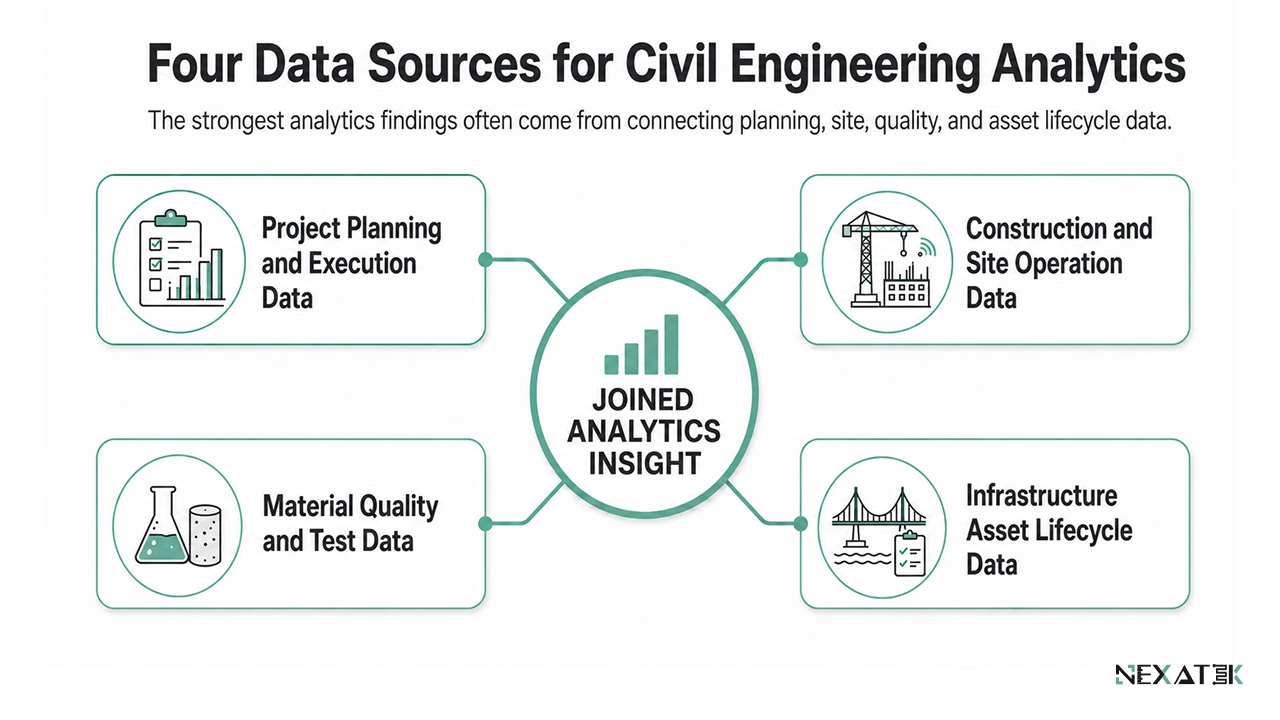
Projektplanlægnings- og udførelsesdata
Tidsplaner, milepæle, ressourceallokeringer, ændringsordrer og betalingsregistreringer beskriver, hvordan et projekt blev planlagt, og hvordan det reelt forløb. Projektanalyse til bygge- og anlægssektoren sammenholder plan med virkelighed. Typiske resultater omfatter varighedsfordelinger for delprocesser på tværs af afsluttede projekter samt de økonomiske konsekvenser af ændringsordrer pr. entreprise. En entreprenør, der kender sin dokumenterede gennemsnitstid for støbning af et 40 meter langt brodæk, kalkulerer det næste projekt på baggrund af historisk evidens frem for mavefornemmelser.
Byggeplads- og produktionsdata
Tilsynsdagbøger, maskintimer, støbejournaler, vejrobservationer og følgesedler dokumenterer den daglige drift. Den analytiske værdi afhænger direkte af datakvaliteten under indsamlingen. Tilsynsnotater i fritekst vanskeliggør analyser, hvorimod data indtastet via strukturerede skemaer i apps til mobil dataindsamling ankommer klar til behandling. Når pladsdata først er strukturerede, kan de besvare operationelle spørgsmål – f.eks. hvor mange maskintimer der medgik pr. kubikmeter råjordsudgravning i den forgangne sæson.
Materiale-, kvalitets- og prøvningsdata
Receptdesign, blandeprotokoller, 28-døgns trykstyrkeresultater og afvigelsesrapporter udgør kvalitetsdatasættet. Analyser på tværs af disse data afdækker mønstre, som enkeltstående tests overser: Ét lavt trykprøveresultat er statistisk støj. Et fald i styrken på 12 procent over samtlige leverancer fra et specifikt værk inden for en måned er derimod et fund, der kræver omgående handling. Trendanalyser viser desuden, om styrkespredningen indsnævres eller udvides over tid – et direkte input til optimering af betonrecepter.
Infrastruktur- og anlægslivscyklusdata
Infrastrukturdata udvikler sig over årtier snarere end over projektmåneder. Tilstandskarakterer, inspektionsvurderinger, vedligeholdelseshistorik og langsigtede moniteringstal dokumenterer, hvordan broer, stikledninger, vejbelægninger og støttemure ældes. Infrastrukturdataanalyse sammenligner nedbrydningshastigheder på tværs af anlægstyper. Hvis underføringer på én strækning falder en tilstandsklasse på 8 år sammenlignet med et gennemsnit på 14 år for det samlede vejnet, kan indsatsen prioriteres derefter. Den lange observationshorisont gør denne kategori stærkt afhængig af ensartede, historiske data.
Dataanalyse vs. traditionel rapportering i anlægssektoren
Rapportering og dataanalyse trækker på de samme byggepladsregistreringer og kontrolskemaer, men adresserer vidt forskellige spørgsmål. Forskellen afgør metodernes værdi, når projektet rammes af omkostnings- eller kvalitetsmæssige udfordringer.
Deskriptiv rapportering og dens begrænsninger
En månedlig fremdriftsrapport beskriver, hvad der er sket: procentvis færdiggørelse, forbrug holdt op mod budget samt godkendte og afviste kontroller. Deskriptiv rapportering fungerer fint som kommunikationsredskab og kontraktuel dokumentation. Begrænsningerne opstår, når der stilles opfølgende spørgsmål: Formatet og detaljeringsgraden er fastlåst, og rapporteringsperioden er allerede afsluttet. En rapport, der viser 78 procents færdiggørelse af jordarbejdet, kan ikke forklare, hvilke sjak eller stationeringer der er forsinkede.
Analytiske tilgange og ingeniørmæssig indsigt
Analytisk arbejde tager udgangspunkt i en problemstilling frem for en fast rapportskabelon. Forespørgsler kan spænde på tværs af projekter og tidsintervaller, og resultaterne kan opdeles på ny, så snart det første svar afføder et nyt spørgsmål. Anvendt på samme jordarbejdseksempel vil dataanalysen kunne sammenligne produktiviteten opdelt på sjak, jordklasse, vejrlig og transportafstand.
Afvejningen er reel: Analysearbejde kræver strukturerede data og et teknisk forarbejde, som en standard rapportskabelon ikke forudsætter. De indledende uger af et analyseinitiativ går derfor typisk med datarensning frem for færdige konklusioner. Mange virksomheder fastholder deskriptiv rapportering til formel orientering og anvender dataanalyse til datadrevet optimering af ingeniørarbejdet.
Dataanalyse i de tekniske arbejdsgange
Dataanalyse opnår først reel værdi, når den integreres i den måde, ingeniørteams allerede arbejder på. Tre faser i arbejdsgangen er afgørende for integrationen.
Dataindsamling og forberedelse
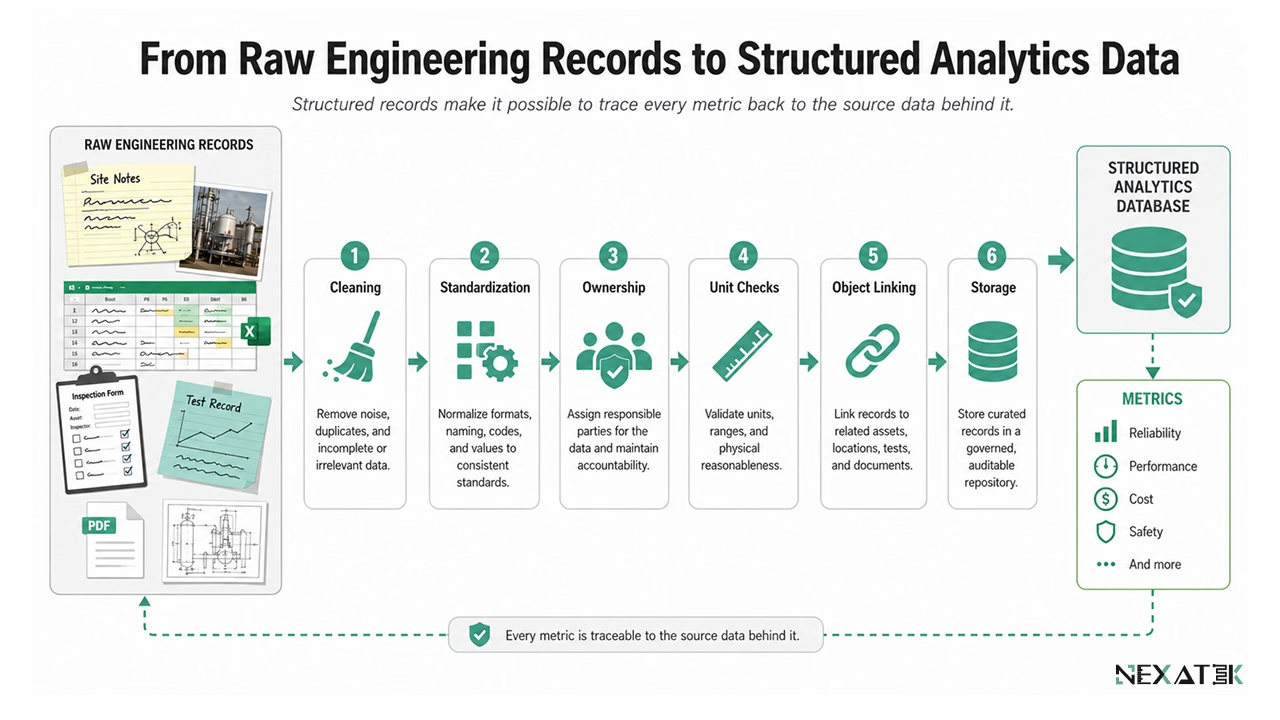
Klargøring af data kræver oftest mere arbejde end selve analysefasen. Ingeniørdata modtages ofte med varierende måleenheder, inkonsistente betegnelser, duplikater og manglende referencer – f.eks. et trykstyrkeresultat uden tilknyttet batchnummer. Datarensning udbedrer disse mangler efterfølgende, men datastruktur forebygger dem ved kilden. Konsistent lagring i specialbyggede systemer udgør den holdbare løsning. Af samme grund indledes analyseprojekter ofte med skræddersyet databaseudvikling frem for visualiseringer.
Et operationelt minimum bør gælde for alle registreringer: en dataejer, en dato, en enhed og en entydig reference til det fysiske objekt, posten beskriver.
Analyse, fortolkning og ingeniørfagligt skøn
Tal fortolker ikke sig selv. En afviger i et prøvningsdatasæt kan skyldes en prøveudtagningsfejl, mangelfuld hærdning, en tastefejl eller et reelt materialesvigt. Kun et ingeniørfagligt skøn kan skelne mellem disse scenarier. Dataanalyse fungerer som beslutningsstøtte: Den leder opmærksomheden mod de målinger, der berettiger ingeniørens tidsforbrug, og kvantificerer relationer, som erfaringen allerede peger på.
Fuld sporbarhed understøtter dette faglige skøn. NEXATEK opbygger analyseresultater således, at hvert enkelt nøgletal refererer direkte tilbage til de oprindelige rådata og beregningsmetoden, så rådgiveren kan efterprøve ethvert tal før videre handling.
Integration med eksisterende fagsystemer og processer
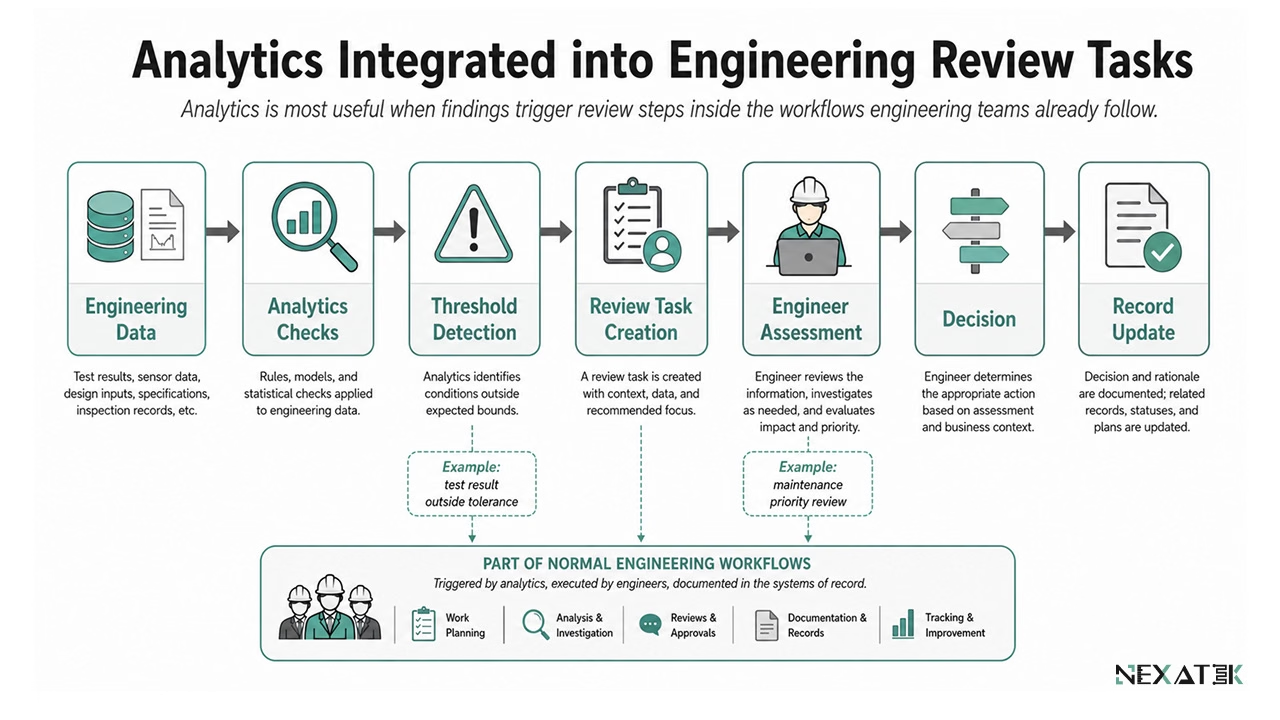
Analyser, der isoleres i et separat program, mister hurtigt deres anvendelighed. Resultaterne skal gøres tilgængelige der, hvor beslutningerne rent faktisk træffes – f.eks. på det ugentlige produktionsmøde eller i forbindelse med budgetteringen af anlægsvedligehold.
Integrationen sker i praksis ad to veje: Relevante nøgletal kan føres direkte ind i de systemer, teams allerede benytter. Analytiske kontrolrutiner kan desuden indlejres via procesoptimering, så et prøvningsresultat uden for tolerancen automatisk opretter en opfølgningsopgave for den ansvarlige ingeniør.
Anvendelsesmuligheder på tværs af organisationer i byggeriet
De analytiske prioriteter følger de data, organisationen råder over. En elementfabrik stiller andre spørgsmål til sine data end en vejmyndighed gør.
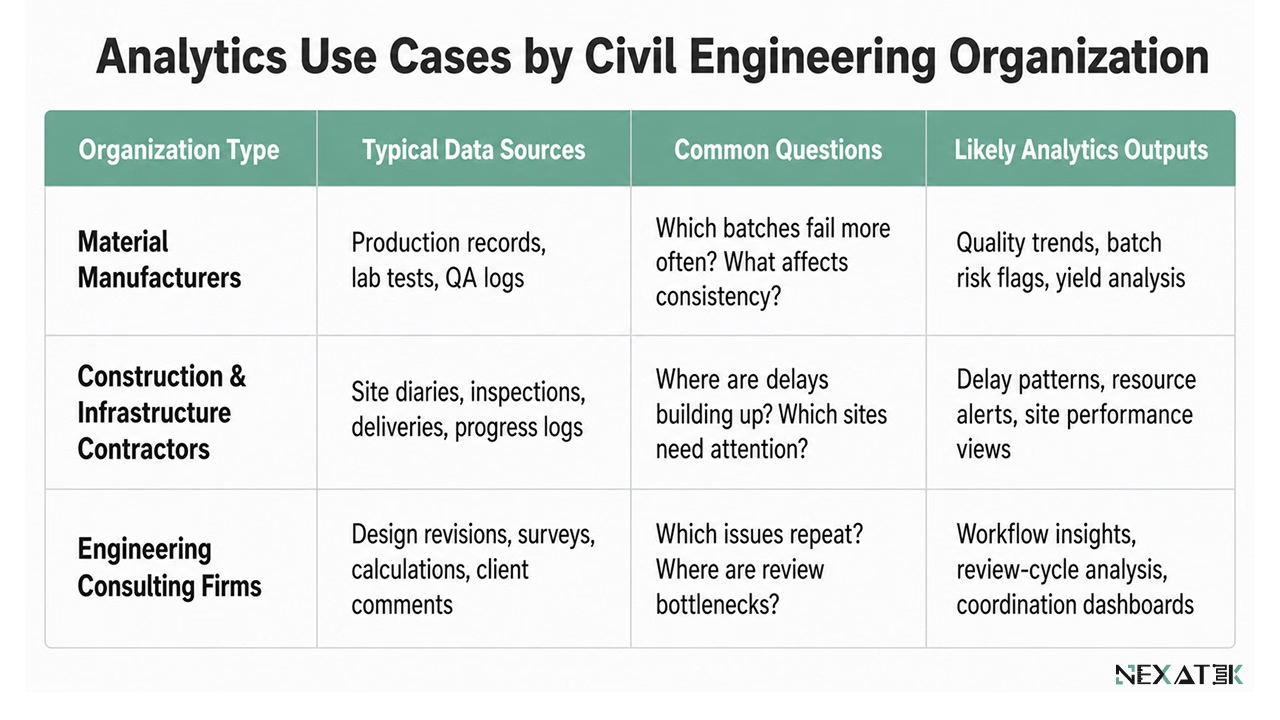 Denne oversigt sammenligner centrale datakilder, typiske problemstillinger og konkrete analysefordele for materialeproducenter, entreprenører og rådgivende ingeniørvirksomheder.
Materialeproducenter og produktionsanalyse
Producenter af fabriksbeton og betonelementer råder over detaljerede produktionsdata. Ydeevneanalyser korrelerer fremstillingsparametre med prøvningsresultater: cementsort over for trykstyrkespredning, eller afhærdningstemperatur over for tidlig styrkeudvikling. En elementfabrik, der sammenholder data fra 400 produktionscyklusser, kan præcist identificere, hvilken parameterændring der udløste en kvalitetsforringelse. Samme analyser understøtter produktudviklingen, da omkostninger og tekniske egenskaber kan vurderes specifikt pr. produktlinje i stedet for via fabriksgennemsnit.
Entreprenører og anlægsvirksomheder
Entreprenører genererer de mest omfattende datastrømme i byggeriet, men udnytter dem ofte mindst. Områder med høj værdiskabelse omfatter sjakproduktivitet, maskinudnyttelse, underentreprenørers leverancer på tværs af entrepriser samt vejrrelateret stilstand. Strukturerede data fra tilsynsdagbøger udgør desuden et stærkt aktiv ved kravshåndtering (claims): Validerede dagsrapporter for en omtvistet periode underbygger krav med dokumenteret fakta frem for personlig erindring.
Tilbudsarbejdet trækker på samme datagrundlag. Når kalkulerede tider og enhedspriser holdes op mod faktiske målinger fra afsluttede opgaver, bliver anlægsanalytik et strategisk værktøj til at styrke konkurrenceevnen.
Rådgivende ingeniørvirksomheder
Rådgivende ingeniører anvender dataanalyse i to retninger: Internt viser tidsregistreringsdata fra tidligere opgaver, hvor projekteringstimerne reelt anvendes, hvilket skærper honorarestimaterne ved fremtidige udbud. Eksternt analyserer rådgiverne bygherrens anlægsdata – f.eks. tilstandsvurderinger af en samlet kommunal brobestand – og leverer prioriterede vedligeholdelsesplaner. Metodeudviklingen til sådanne analyser overlapper med anvendt forskning og udvikling, hvor analysemetoder testes, før de anvendes på kundens data. NEXATEK understøtter begge retninger med tekniske analyseløsninger tilpasset de data, virksomheden allerede råder over.