

API for å beregne CO2-utslipp
En kraftig API som gjør det mulig for programvareplattformer, ingeniørapplikasjoner og bedriftssystemer å beregne karbonutslipp nøyaktig og effektivt. NEXATEK leverer skalerbare, utviklervennlige løsninger som forenkler karbonregnskap gjennom sømløs integrasjon, standardiserte datasett og høyytelses skyarkitektur.
Motor for karbonberegning

API-integrasjon og utviklerverktøy

Datahåndtering og tilpasning

Rapportering og bedriftsfunksjoner

Ofte stilte spørsmål
Sporing av CO2-utslipp er prosessen med å estimere og analysere karbonfotavtrykket som genereres gjennom livssyklusen til et bygg...
Sporing av utslipp gir deg en klar forståelse av din miljøpåvirkning...
Vi bruker bransjeanerkjente metodikker, livsløpsvurderingsverktøy (LCA), materialfotavtrykksanalyse og data om energiforbruk...
Lavere utslipp fører til reduserte energiregninger, forbedret effektivitet, bedre overholdelse av miljøforskrifter...
Sporing av CO2-utslipp er verdifullt på tvers av alle sektorer...
Lignende prosjekter
Oppdag flere innovative prosjekter:



Gode
Løsninger
Starter Med En SamtaleGode Løsninger Starter Med En Samtale
Vil du utforske hvordan våre tjenester kan få bedriften din til å vokse?
Carbon Emissions API for bygg- og anleggssektoren
Hver eneste betongstøp, stålleveranse og maskintime med gravemaskin på et infrastrukturprosjekt har en målbar klimabelastning. Et carbon emissions API gjør disse verdiene tilgjengelige som strukturerte data som teknisk programvare kan hente ut ved behov. Når mengdene justeres, oppdateres utslippstallene umiddelbart. NEXATEK utvikler denne formen for data-infrastruktur for utslippsdata tilpasset bygg- og anleggsbransjen, som regel som en del av et mer omfattende program for digital transformasjon. Dermed blir klimadata en integrert del av verktøyene rådgivere og entreprenører allerede jobber i.
 Et carbon emissions API gjør prosjektmengder om til strukturerte klimadata som ingeniører kan utnytte på tvers av sine systemer.
Hva er et Carbon Emissions API?
Et carbon emissions API er et programvaregrensesnitt som tar imot prosjektmengder og returnerer kalkulerte utslippsverdier. Et fagsystem sender en forespørsel som beskriver et materiale eller en arbeidsoperasjon, for eksempel 450 m³ betong i fasthetsklasse C30/37. Tjenesten kobler forespørselen mot en database over utslippsfaktorer og returnerer svaret oppgitt i kilo CO2-ekvivalenter (kgCO2e). Det er overhodet ikke nødvendig å åpne et regneark underveis.
Grensesnittet samler beregningslogikken for klimagassregnskapet for hele virksomheten. Alle prosjekter som kobler seg til, benytter nøyaktig de samme faktorene og identiske enhetskonverteringer. Brukersystemene omfatter alt fra BIM-tillegg til innkjøpssystemer. Hvis en faktor revideres, blir oppdateringen umiddelbart tilgjengelig for alle konsumenter samtidig. Brukt på denne måten fungerer et API for klimafotavtrykk som enhver annen delt ingeniørtjeneste: én felles beregningsmetode for en rekke ulike klientsystemer.
Hvorfor anleggsprosjekter krever utslipps-API-er
Et omfattende motorveikryss inneholder tusenvis av utslippsrelevante poster: betongresepter, armeringsstål, masseflytting og transportavtaler. Hver enkelt post har sin egen utslippsfaktor, og mange av disse faktorene endrer seg underveis i prosjektets levetid. Å følge opp et slikt bevegelig datasett manuelt lar seg ikke skalere.
Kompleksiteten i utslippsdata for bygg og anlegg
To leveranser av samme betongkvalitet kan ha helt ulikt CO2-avtrykk. Reseptutformingen, sementkilden, transportavstanden og selve betongblandeverket påvirker alle det endelige tallet. Multipliserer man denne variasjonen over hundrevis av materialer og flere byggefaser, blir datamengdens kompleksitet åpenbar.
Infrastrukturprosjekter strekker seg dessuten over flere år. En utslippsfaktor som gjaldt i tilbudsfasen, kan være utdatert innen den aktuelle entreprisekontrakten skal tildeles. Prosjekteringsendringer skaper ytterligere dynamikk: Dersom en går over fra prefabrikkerte brobjelker til plasstøpt betong, endres materialmengder og transportavstander parallelt.
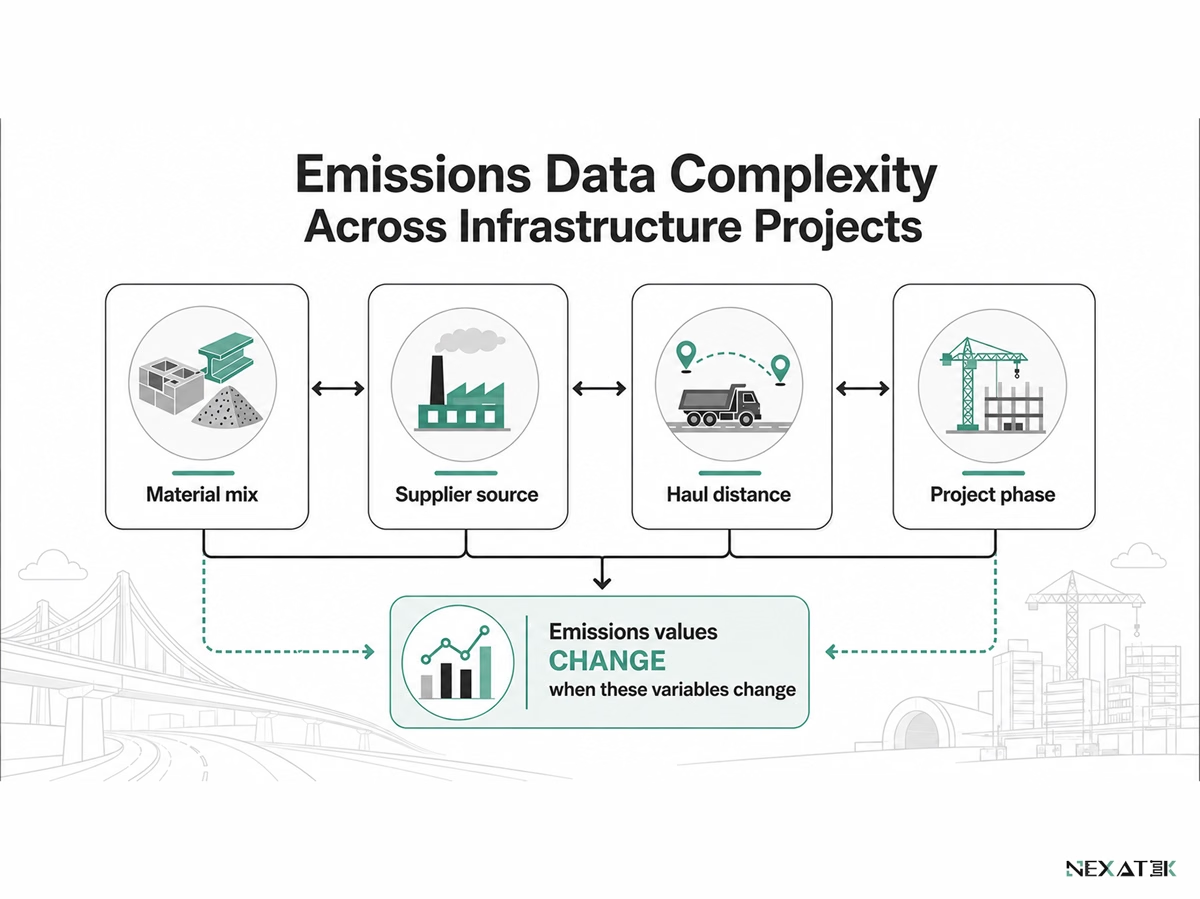 Utslippsverdiene endrer seg fortløpende i takt med endringer i materialer, leverandører, transportruter og prosjektfaser.
Begrensninger ved manuelle og regnearkbaserte beregninger
Regneark fungerer godt for enkle kalkyler, men mister raskt oversikten etter hvert som prosjektene vokser. Klassiske feilkilder er formler som overskrives og utslippsfaktorer som ukritisk kopieres fra tidligere prosjekter. En enhetsfeil – for eksempel at tonn legges inn der formelen forventer kilo – forstørrer resultatet med en faktor på 1 000 og kan gå ubemerket gjennom flere tverrfaglige kontroller.
Versjonskontroll er en annen vesentlig svakhet. Når fem ingeniører sitter med hver sin kopi av beregningsfilen, er det umulig å fastslå hvilket tall som gjelder. Ved å samle beregningene i én felles tjeneste fjerner man denne usikkerheten, og det er grunnen til at klimaregnskap ofte etableres som en del av en helhetlig prosessoptimalisering.
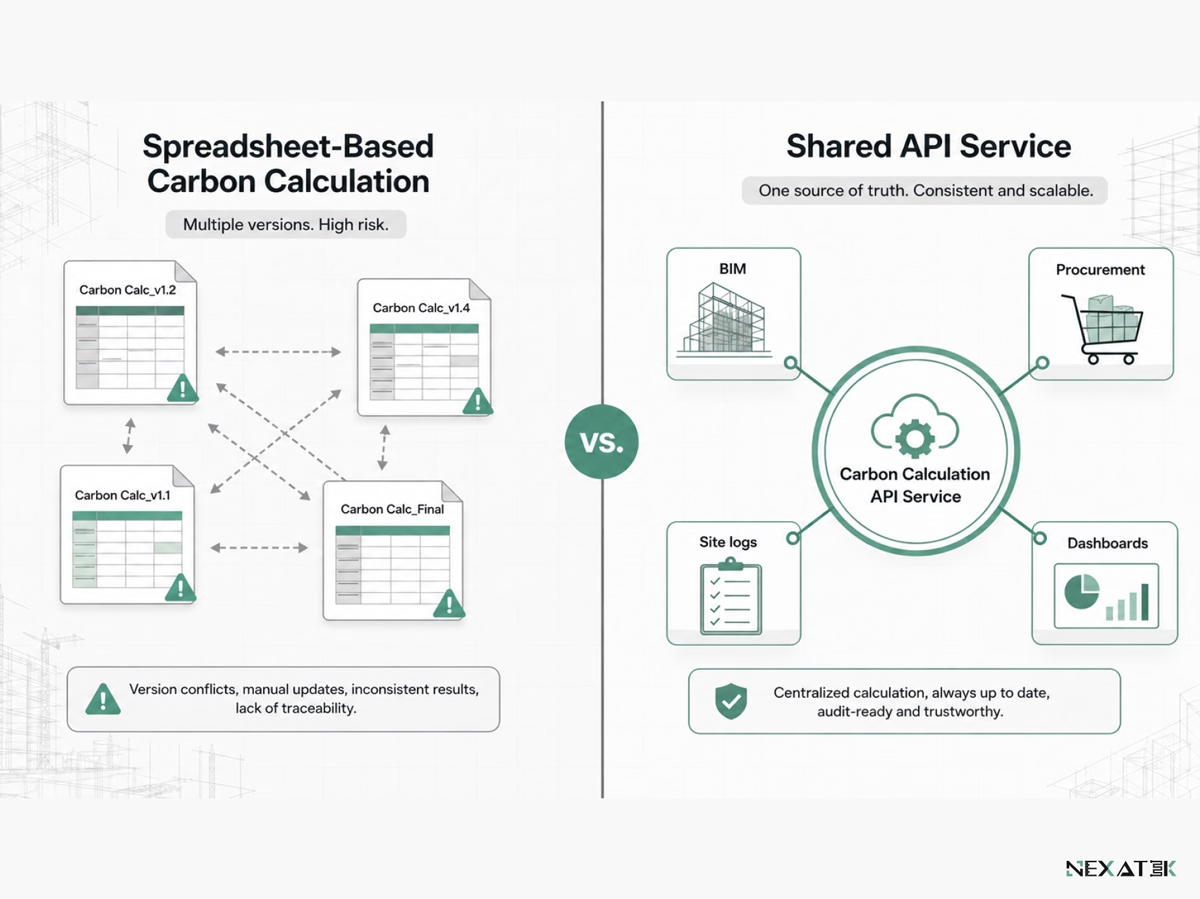 Et felles API reduserer risikoen knyttet til versjonskontroll ved å samle beregningsmetoden på ett felles sted.
Typer klimagassdata i anleggsvirksomhet
Klimadata i bygg- og anleggssektoren faller inn under distinkte kategorier med ulike datakilder og oppdateringsfrekvenser. Et carbon emissions API for bygg og anlegg må håndtere samtlige kategorier for å levere et helhetlig prosjektresultat. Fire kategorier dekker behovet i de aller fleste prosjekter.
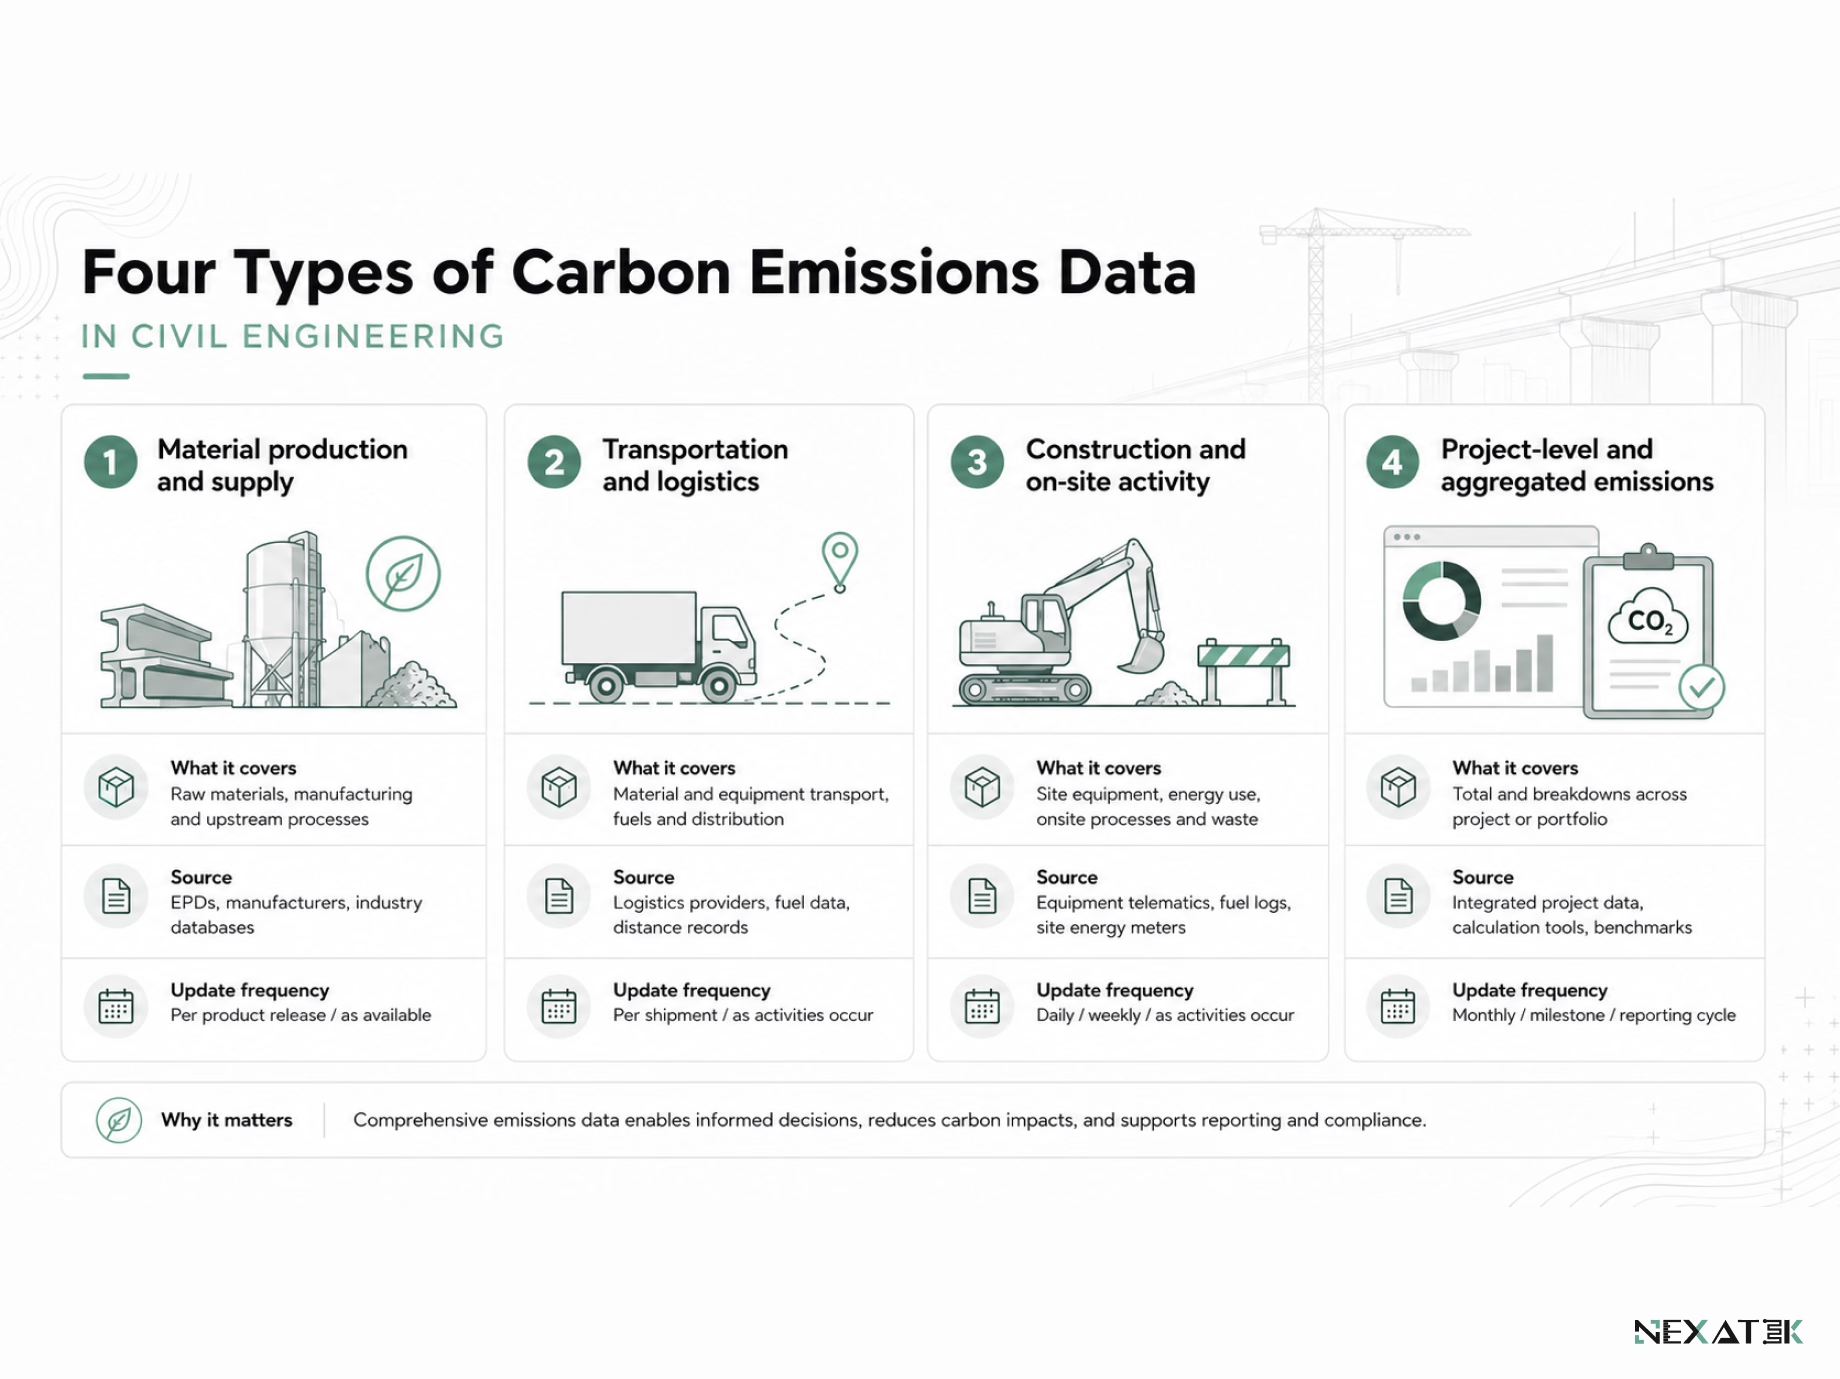 API-et må håndtere data for materialer, transport, byggeplassdrift og aggregerte prosjekttall i en samlet løsning.
Materialproduksjon og råvareutslipp
Materialer utgjør hovedtyngden av det bundne karbonet (embodied carbon) i de fleste anleggskonstruksjoner, med betong og stål som de dominerende komponentene. Den primære datakilden er miljødeklarasjoner (EPD-er) – leverandørspesifiserte dokumenter som oppgir utslippene forbundet med fremstilling av en gitt produktenhet. Når EPD-verdier struktureres etter leverandør og materialkvalitet, blir en sammenligning mellom to stålleverandører i innkjøpsfasen til en enkel dataforespørsel.
Transport- og logistikkutslipp
Å transportere 30 tonn tilslagsmaterialer over en distanse på 120 km gir et helt annet utslipp med jernbane enn med lastebil. Transportutslipp avhenger av lastens vekt, transportavstand, transportmiddel og drivstofftype. Siden ruter og speditører ofte justeres under byggefasen, er materialtransport blant de mest dynamiske datapunktene prosjektet håndterer.
Utslipp fra anleggsdrift og byggeplassaktivitet
Forbrenning av drivstoff i anleggsmaskiner og midlertidig byggestrøm står for størsteparten av de direkte byggeplassutslippene. Relevante inndata er maskintimer og drivstoffvolum, som kan registreres via mobile verktøy for datainnsamling eller telemetriløsninger i maskinparken. Omregnet per arbeidsoperasjon viser disse dataene hvilke byggefaser som driver utslippene på plassen.
Data på prosjektnivå og aggregerte tall
Prosjektledelsen har behov for det konsoliderte overblikket. Det innebærer klimagassdata samlet per delprosjekt eller per rapporteringsperiode. En pålitelig aggregering fungerer bare når samtlige underliggende oppføringer følger en enhetlig datastruktur – noe som stiller like store krav til databasedesign som til beregningslogikk. NEXATEK kombinerer derfor gjerne API-et med skreddersydd databaseutvikling, slik at overordnede styringstall hviler på nøyaktig de samme detaljerte registreringene som samles inn ute på anlegget.
Hvordan fungerer et Carbon Emissions API i ingeniørsystemer?
Dataflyten gjennom tjenesten er enveis og strukturert: Ingeniørsystemene sender prosjektmengder inn, og strukturerte utslippsverdier leveres i retur. Hos NEXATEK starter integrasjonsarbeidet alltid med to konkrete avklaringer: hvilke systemer leverer grunnlagsdataene, og hvilke programmer skal benytte resultatene?
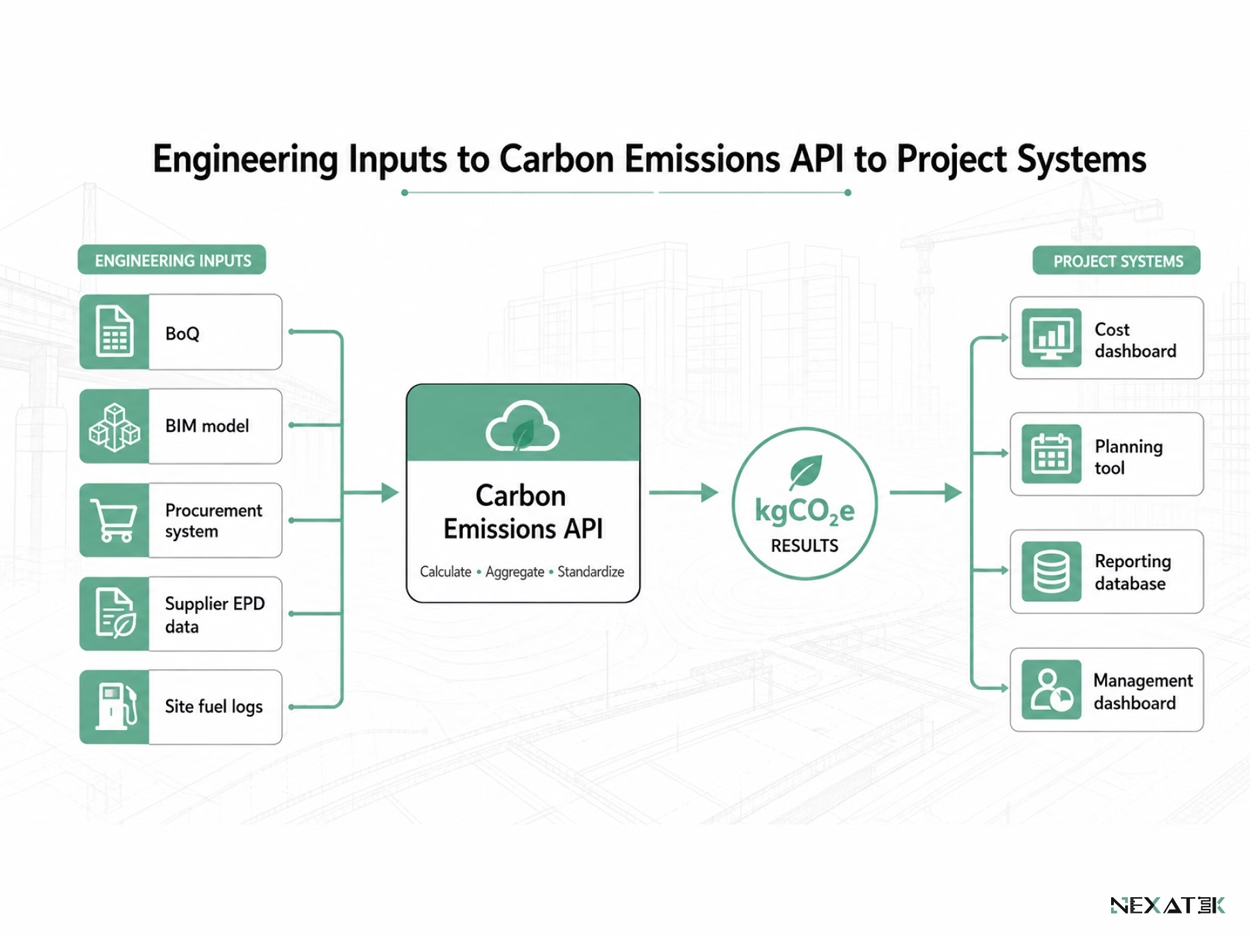 Fagsystemer overfører strukturerte data til API-et og mottar enhetlige kgCO2e-resultater i retur.
Inndataparametere og tekniske datakilder
Inndataene hentes fra registreringer ingeniørene allerede fører. Mengdebeskrivelser og posteringslister gir materialtyper og volum – gjerne eksportert fra en BIM-modell. Innkjøpssystemer tilfører leverandørinformasjon, mens byggeplassens driftssystemer legger til drivstofflogger. Hver forespørsel inneholder fire felter: en artikkelkode, en mengde, en enhet og en prosjektreferanse. Forespørsler som mangler måleenhet avvises av grensesnittet i stedet for at systemet baserer seg på usikre antakelser.
Beregningslogikk og datanormalisering
Første steg er datakobling. Tjenesten finner frem til riktig utslippsfaktor basert på artikkelkoden, og prioriterer leverandørspesifikke EPD-verdier foran regionale gjennomsnitt. Deretter følger normalisering: Hvis én leverandør oppgir betong i kubikkmeter og en annen i tonn, sørger en densitetsfaktor for at begge konverteres til samme beregningsgrunnlag. Svarene leveres konsekvent i kgCO2e, noe som gjør verdiene fullt sammenlignbare på tvers av prosjekter og leverandører.
Utdataformater og systemintegrasjon
Resultatene returneres i et maskinlesbart format, som regel JSON. Ethvert mottakersystem kan integrere klimadataene direkte i sine visninger: Et økonomisk dashbord viser utslipp ved siden av kostnader, og et planleggingsverktøy kobler utslippene til fremdriftsplanen. Når svarene lagres i en sentral database, forblir dataene søkbare også etter at prosjektet er ferdigstilt, noe som styrker virksomhetens helhetlige miljø- og bærekraftsrapportering.
Carbon Emissions API-er vs. statiske rapporteringsverktøy
De to tilnærmingene skiller seg fundamentalt i hvordan de håndterer prosjektendringer. På et levende anleggsprosjekt er endringer normalen, og denne forskjellen trer frem i den daglige driften.
Begrensninger ved statiske rapporter og enkeltberegninger
En statisk rapport beskriver prosjektet nøyaktig slik det sto den dagen rapporten ble forfattet. Revisjoner i prosjekteringen og leverandørbytter som skjer i etterkant, fanges ikke opp. For å oppdatere tallene må hele kalkulasjonen kjøres på nytt, noe som gjør at en ingeniør som vurderer et lavkarbonalternativ for et brudekke, må vente helt til neste rapporteringssyklus for å se utslaget. Sporbarheten svekkes tilsvarende, fordi koblingen mellom rådata og publiserte tall utelukkende eksisterer i en isolert regnearkfil.
Fordeler med API-baserte utslippsdata
API-baserte utslippsdata rekalkuleres automatisk hver gang inndataene endres. En revidert mengdebeskrivelse resulterer i oppdaterte klimaberegninger samme dag, i stedet for ved neste formelle rapporteringsmilepæl. Sentralisert og versjonsstyrt beregningslogikk gir i tillegg full sporbarhet: En revisor kan spore et hvilket som helst publisert utslippstall tilbake til den nøyaktige faktoren og mengdeposten som genererte det. De samme strukturerte miljødataene tjener både prosjekteringsgjennomganger og virksomhetsrapportering uten behov for manuell registrering på nytt.
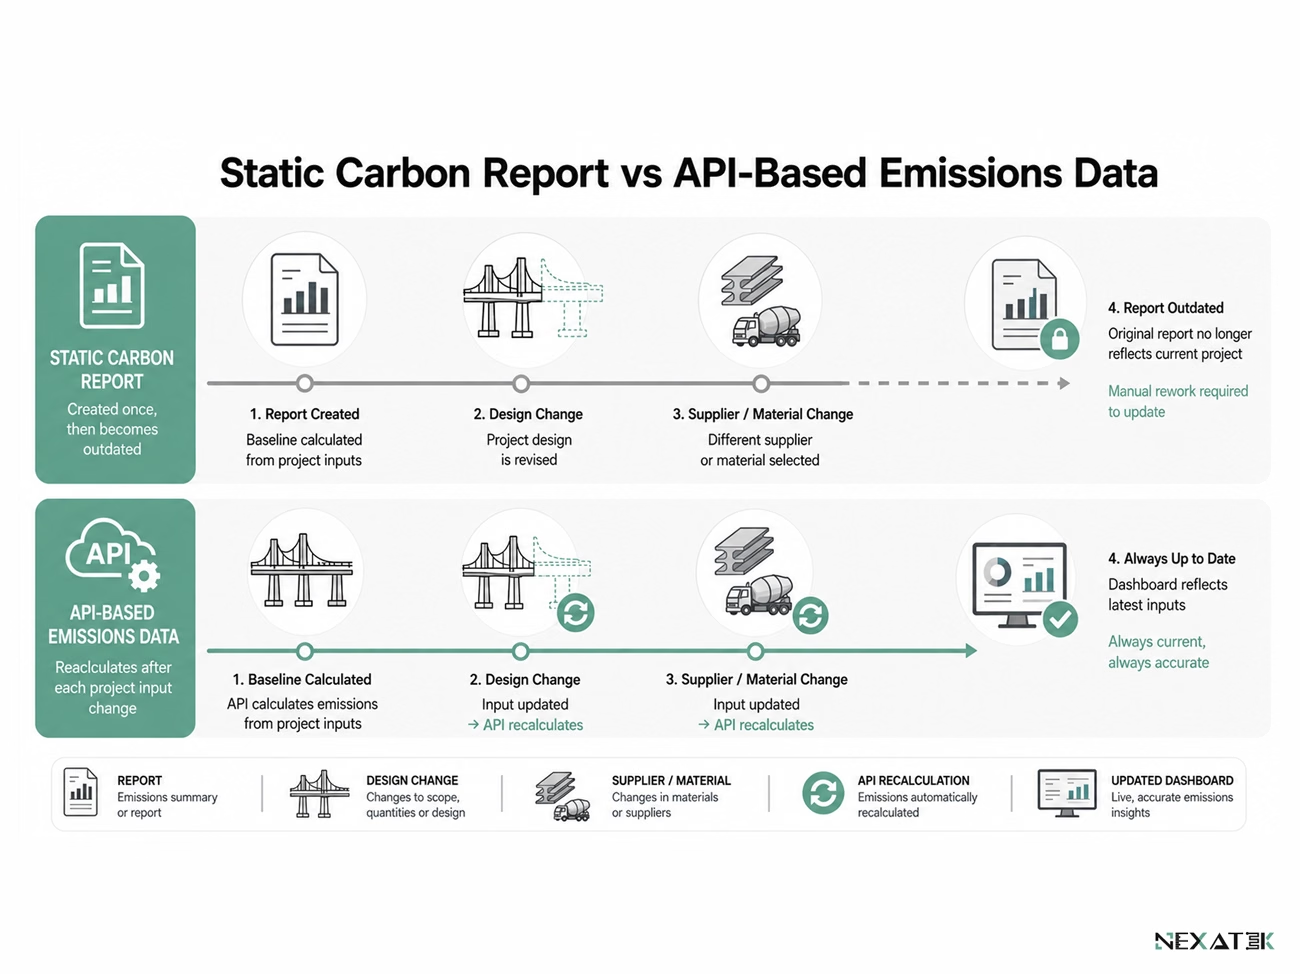 Statiske rapporter dokumenterer ett bestemt tidspunkt, mens API-baserte data oppdateres dynamisk i takt med prosjektendringene.
Bruksområder i byggenæringens verdikjede
Aktørene i verdikjeden anvender klimadata til ulike formål. Én felles API-tjeneste kan ivareta samtlige roller nedenfor gjennom skreddersydde integrasjoner.
Materialprodusenter og utslippssporing
En betongelementprodusent besitter de mest presise dataene om egne produkter. Ved å tilgjengeliggjøre disse dataene via et API kan kundene hente oppdaterte CO2-verdier på produktnivå direkte inn i prosjekteringsverktøyene sine. Mange produsenter gir denne tilgangen via en kundeportal der oppdragsgivere og rådgivere kan hente ut teknisk dokumentasjon og klimadata på ett og samme sted.
Entreprenører og anleggsvirksomheter
Entreprenører benytter API-et til løpende å sammenligne reelle utslipp med kalkylene fra anbudsfasen under anleggsperioden. Drivstofflogger fra anleggsplassen og digitale følgesedler mates inn i API-et daglig. Avvik avdekkes tidsnok til at tiltak kan iverksettes, og underentreprenørers tall registreres via de samme strukturerte løsningene i stedet for via e-poster med regneark.
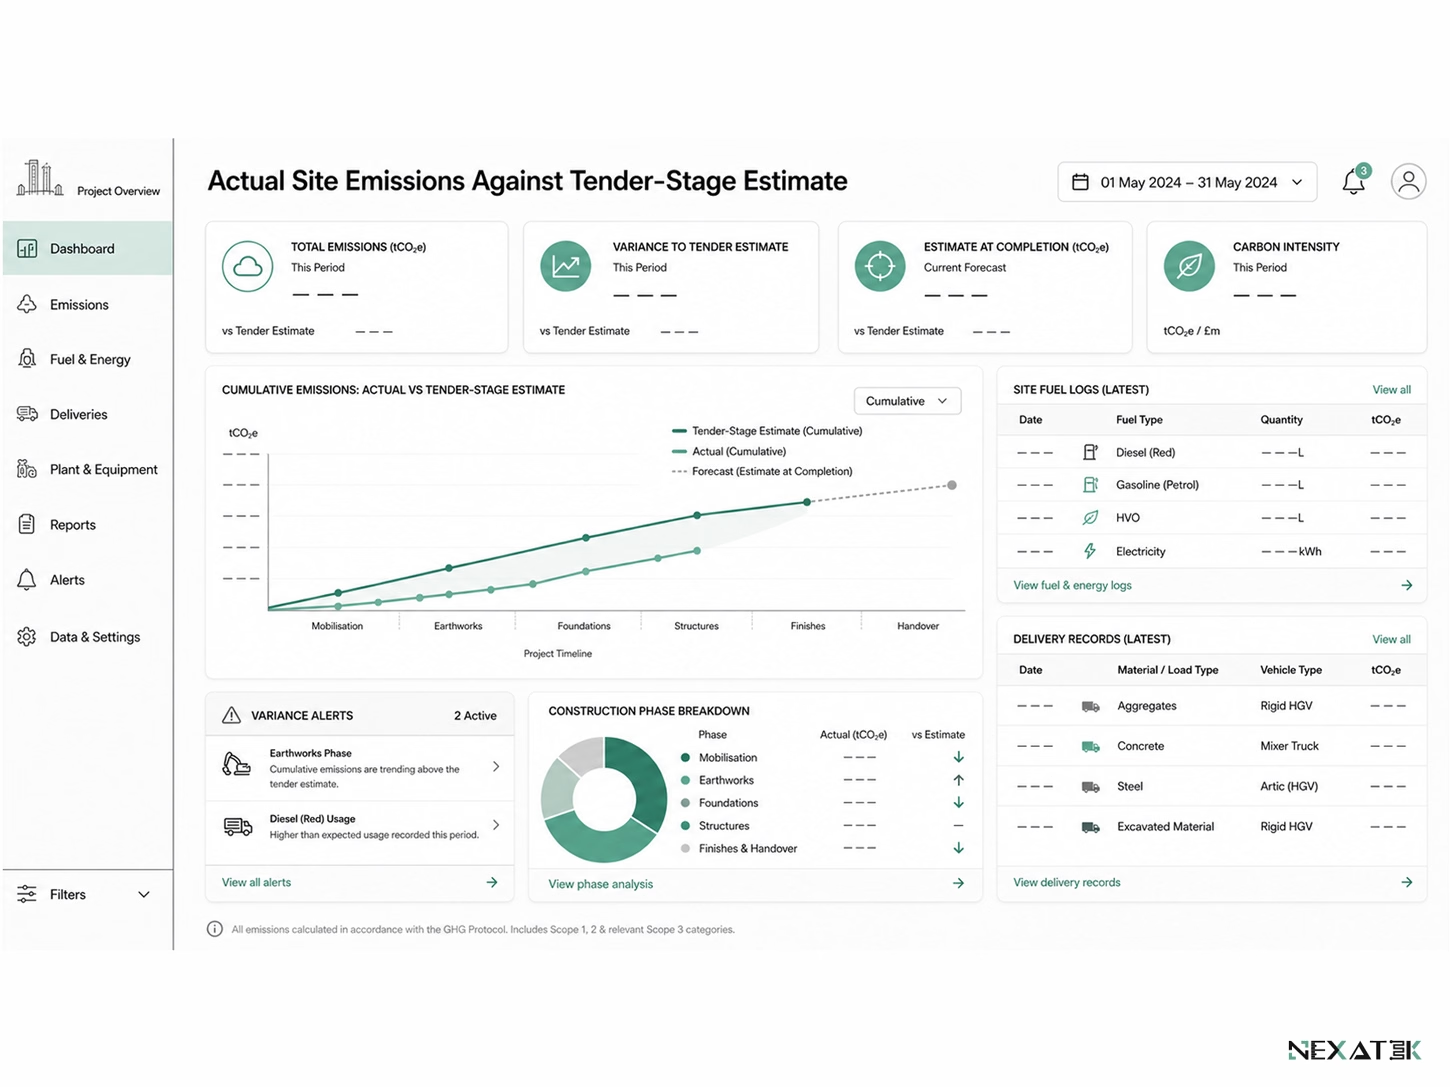 Entreprenører kan kontinuerlig sammenholde byggeplasslogger og leveransedata med det opprinnelige CO2-estimatet under bygging.
Rådgivende ingeniørselskaper
Rådgivende ingeniører kjører de tyngste analysene i konseptfasen under valg av bærende prinsipper. To ulike brudekkeutforminger med tilnærmet lik anleggskostnad kan variere betydelig i bundet karbon, og en API-spørring tallfester denne differansen på få minutter. NEXATEK kobler disse beregningstjenestene direkte til modellerings- og dimensjoneringsverktøyene rådgiverne benytter til daglig.